2011 Financial overview
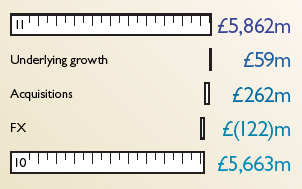
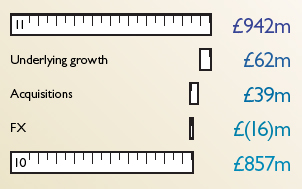
In 2011, Pearson increased sales by 4% in headline terms to £5.9bn and adjusted operating profit from continuing operations by 10% to £942m.
The headline growth rates were reduced by currency movements and helped by acquisitions. Currency movements reduced sales by £122m and operating profits by £16m. This was the result of the weakening of the US dollar and other currencies against sterling: we generated approximately 60% of our sales and profits in US dollars and the average exchange rate moved from £1:$1.54 in 2010 to £1:$1.60 in 2011. At constant exchange rates (i.e. stripping out the impact of those currency movements), our sales and adjusted operating profit grew 6% and 12% respectively.
Acquisitions, primarily in our education company, contributed £262m to sales and £39m to operating profits. This includes integration costs and investments related to our newly‑acquired companies, which we expense.
Our reshaping of Pearson continues to have a significant impact on our financial results. We sold Interactive Data in July 2010: it contributed seven months of sales, profits and cash in that year and none in 2011. We sold our 50% stake in FTSE International to the London Stock Exchange for net proceeds of £428m in December 2011: it contributed 2.2p to Pearson’s earnings per share in 2011.
Our underlying revenue and operating profit (i.e. stripping out the benefit of both portfolio changes and currency movements) grew 1% and 7% respectively.
Our tax rate in 2011 was 22.4%, compared to 25.2% in 2010, reflecting a non-recurring benefit from settlement of various prior year tax affairs.
We increased adjusted earnings per share by 12% in headline terms to 86.5p.
Sales growth £m
Operating profit growth
£m
Cash generation
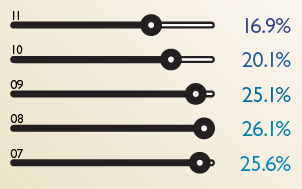
Headline operating cash flow declined by £74m as cash conversion returned to a more normalised rate of 104% (compared to 113% in 2010). The contribution to cash from working capital reduction was £39m (£149m in 2010, which was unusually high because in a strong adoption year pre-publication amortisation exceeded investment). Free cash flow declined by £132m to £772m, additionally reflecting higher tax payments following utilisation of the remaining available tax losses in 2010. Our average working capital to sales ratio improved by a further 3.2 percentage points to 16.9% reflecting the benefits of our shift to more digital and service‑orientated businesses.
Return on invested capital
Our return on average invested capital was 9.1%, well ahead of our cost of capital. It was lower than the 2010 figure of 10.3%, due to several factors: the sale of Interactive Data, one of our least capital‑intensive businesses; integration charges related to acquisitions; and an increased cash tax rate.
Statutory results
Our statutory results show an increase of £483m in operating profit to £1,226m (£743m in 2010). Basic earnings per share were 119.6p in 2011, down from 161.9p in 2010, with the profits on the sale of FTSE International in 2011 not matching those for Interactive Data in 2010.
Balance sheet
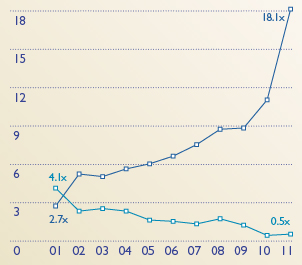
Our net debt increased modestly to £499m (£430m in 2010). We benefited from the proceeds from the sale of FTSE International and strong cash generation, offset by acquisition investment of £896m and sustained investment in our businesses. Since 2000, Pearson’s net debt/EBITDA ratio has fallen from 3.9x to 0.5x and our interest cover has increased from 3.1x to 18.1x.
Dividend
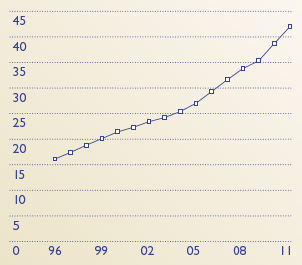
The board is proposing a dividend increase of 9% to 42.0p, subject to shareholder approval. 2011 will be Pearson’s 20th straight year of increasing our dividend above the rate of inflation. Over the past ten years we have increased our dividend at a compound annual rate of 7%, returning more than £2.5bn to shareholders. We have a progressive dividend policy: we intend to sustain our dividend cover at around 2.0x over the long term, increasing our dividend more in line with earnings growth.
Balance sheet strength
Net debt/EBITDA
Dividend per share paid in fiscal
year
Pence
Average working
capital/sales %