
North American Education
“North American Education is Pearson's largest business, with 2011 sales of £2.6bn and operating profit of £493m.”

Digital learning platforms
In 2011 student registrations on our digital learning platforms increased by 23% to 43 million.
Insight for learning
Schoolnet provides assessment, curriculum and other services to help personalise learning and improve teacher effectiveness. It supports more than five million students in primary and secondary education through partnerships with districts and states across the US.

Bringing education home
Connections Education operates online or 'virtual' schools for more than 33,000 students in 21 states across the US. Virtual schools serve a diverse population of students including those who may be gifted, struggling, pursuing careers in sports or the arts, in need of scheduling flexibility, or who have chosen home schooling.

Key performance indicators
| £ millions | 2011 | 2010 | Headline growth | CER growth | Underlying growth |
|---|---|---|---|---|---|
| Sales | 2,584 | 2,640 | (2)% | 1% | (1)% |
| Adjusted operating profit | 493 | 469 | 5% | 9% | 8% |
School publishing
adoption cycle win rates

Assessment and information
testing contract win rates

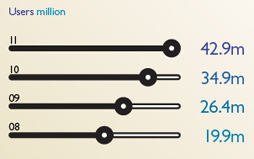
Online learning users
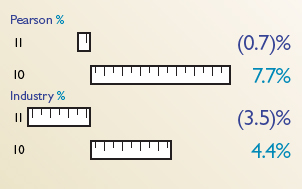
US education publishing
school
and college sales growth vs industry
North American Education is Pearson’s largest business, with 2011 sales of £2.6bn and operating profit of £493m. Building on our roots as a leading publisher of educational materials and provider of assessment services, we have made significant investments and changes to transform Pearson into a world‑leading provider of learning technologies for students and enterprise services for educational institutions. These technology services – including LearningStudio (formerly known as eCollege), OpenClass, PowerSchool, the MyLabs, Data Solutions (Edustructures), Schoolnet and Connections Education – are the backbone of our strategy to help educators raise student performance and institutions to become more effective. In 2011, our strength in digital and services businesses enabled us to perform ahead of our more traditional print publishing markets, which were adversely affected by state budget pressures and decline in college enrolments.
Higher Education highlights in 2011 include:
- The US higher education publishing market was broadly level with 2010, according to the Association of American Publishers, with solid revenue growth in public colleges offset by enrolment declines in for‑profit colleges following changes in Federal regulations.
- Pearson gained share, benefiting from its lead in technology and customisation, and has now grown faster than the US higher education industry for 13 consecutive years.
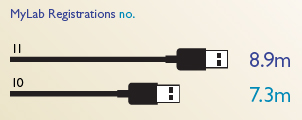
- Pearson’s pioneering ‘MyLab’ digital learning, homework and assessment programmes grew strongly with student registrations in North America up 22% to almost nine million. Usage continues to grow strongly with graded submissions up 39% to almost 250 million across the globe. Evaluation studies show that the use of MyLab programmes can significantly improve student test scores and institutional efficiency.
- We developed a new model of enterprise‑wide support for online higher education with Arizona State University Online and Ocean Community College. Through these long‑term partnerships, Pearson runs the full online learning programmes for these institutions and earns revenues based on the success of the institution and its students.
- Pearson LearningStudio increased fully‑online student enrolments by 20% to ten million. Renewal rates remain high at more than 80% by value with fewer large accounts up for renewal in the year.
- We launched OpenClass, a dynamic, scalable and cloud‑based Learning Management System which encourages social learning and is easy and free to use.
Assessment and Information highlights in 2011 include:
- Revenues at our Assessment and Information division grew modestly in 2011. State funding pressures and the transition to Common Core assessments continued to make market conditions tough for our state assessment and teacher testing businesses; these were offset by good growth in diagnostic and clinical assessments.
- We signed several important contracts including state‑wide student assessment contracts in New York, Kentucky and Arizona; Race to the Top Florida formative assessment; Indiana educator licensing and Ohio pre‑service teacher assessment. We also renewed three important contracts, extending our relationships with Virginia and Maryland for state‑wide student assessments and with ETS to service state‑wide assessments for California.
- We signed an agreement with Stanford University to provide the capability to deliver the Teacher Performance Assessment (TPA) – a nationally available, web-based performance assessment for measuring the effectiveness of teacher candidates nationally.
- We delivered 13 million secure online tests in 2011 with strong growth in automated written and spoken assessment scoring volumes. We won the Online Assessment Readiness Tool contract from both the PARCC and SBAC Common Core consortia to help the 45 states prepare for the transition to online assessments.
- PowerSchool supported more than ten million students, up 6% on 2010, and developed its platform to enable 18 additional languages to be used on the PowerSchool parent portal.
- Our clinical assessment business grew well boosted by strong growth at AIMSweb, our progress monitoring service which enables early intervention and remediation for struggling students. Usage of AIMSweb increased dramatically with 47 million assessments delivered in 2011, up more than 40%.
- We acquired Schoolnet, a fast‑growing and innovative education technology company that aligns assessment, curriculum and other services to help individualise instruction and improve teacher effectiveness. Schoolnet serves more than five million US pre K‑12 students through partnerships with districts and states, supporting about one‑third of America’s largest cities.
School highlights in 2011 include:
- The US school textbook publishing market declined 9% in 2011, according to the Association of American Publishers. There were several pressures on the industry including weakness in state budgets, a lower new adoption opportunity (total opportunity of $650m in 2011 against $800m in 2010) and delays in purchasing decisions during the transition to the new Common Core standards.
- Pearson gained share with a strong adoption performance boosted by our blended print‑and‑digital programmes including Writing Coach, Prentice Hall Math and enVisionMATH. We took an estimated 37% of new adoptions competed for (or 31% of the total new adoption market).
- We acquired Connections Education which operates online K‑12 schools in 21 states and a nationwide charter school programme. It served 33,200 students in 2011, up 43% from 2010. Connections Academy Schools have consistently high performance ratings, particularly in states focused on measuring growth in student learning.
- SuccessNet, our online learning platform for school teachers and students, generated more than six million registrations in 2011, up 5% on 2010. The number of assessments taken through SuccessNet increased by 32% to more than 11 million.
- We continue to develop digital programmes, platforms and apps to boost achievement, access and affordability. We launched two major new school programmes aimed at meeting rising literacy standards under the Common Core:
- i-lit, a personalised digital reading programme. It combines our proven literacy model (with many students making two years of literacy growth in a single year), automated assessment capabilities and compelling literature from Penguin and Dorling Kindersley, all delivered through iPads.
- Pearson English Learning System, which benchmarks, monitors and tracks both student progress and teacher best practice to boost English language skills.
- Poptropica is one of the largest virtual worlds for young children in the US and was named by Time as one of ‘The 50 Best Websites of 2011’. Poptropica has up to 9.7 million monthly unique visitors from more than 130 countries.